Search another article?
Hosts
The host page allows to show all hosts present in the internal database of SGBox and perform operations on them.
Document index
- Main page
- New Host
- Import Host
- Selection
- Edit host
- Multiple Editing
- Remove
- Alert explanation
- Settings
- Messages
Main Page
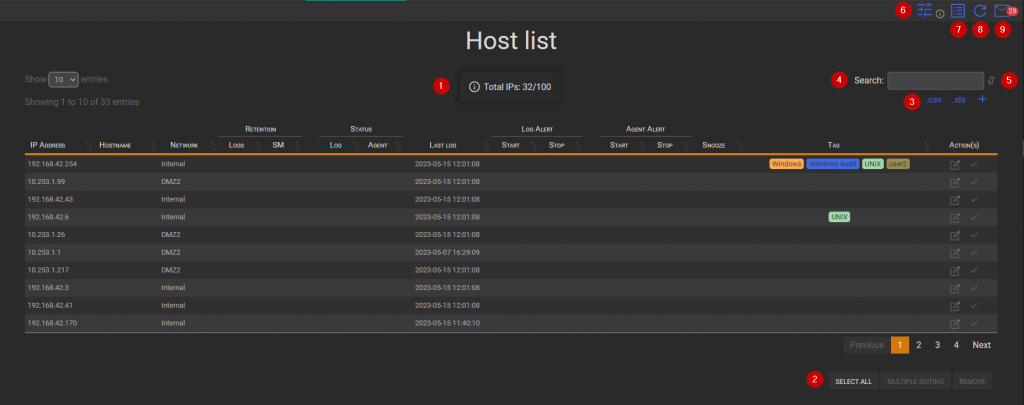
In the Total IPs box (1) it is possible to know the number of hosts allowed based on your license.
The Functions box (2) allows different actions:
In the (3) box:
- .csv downloads the table as csv file.
- .xls downloads the table as xls file.
- The plus icon allows you to add or import hosts.
In the search field box (4) you can filter the results of the table. The system searches for each field of the table based on the characters in the input.
Clicking on the pin icon (5) pins the filter for a future use. If it is blue the filter is pinned.
- Setting icon (6) configures the scripts that work with hosts.
- Legend icon (7) opens a modal window describing various icons.
- Reload icon (8) reloads the page, updating data.
- Message Icon (9) opens a container containing all the notifications generated by SGBox.
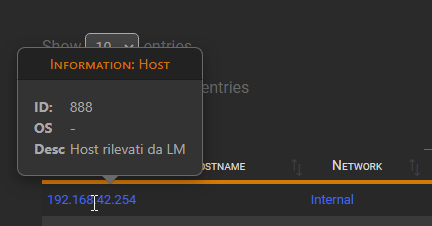
Hovering over the IP label allows you to view information about the host, including its ID, operating system, and description.
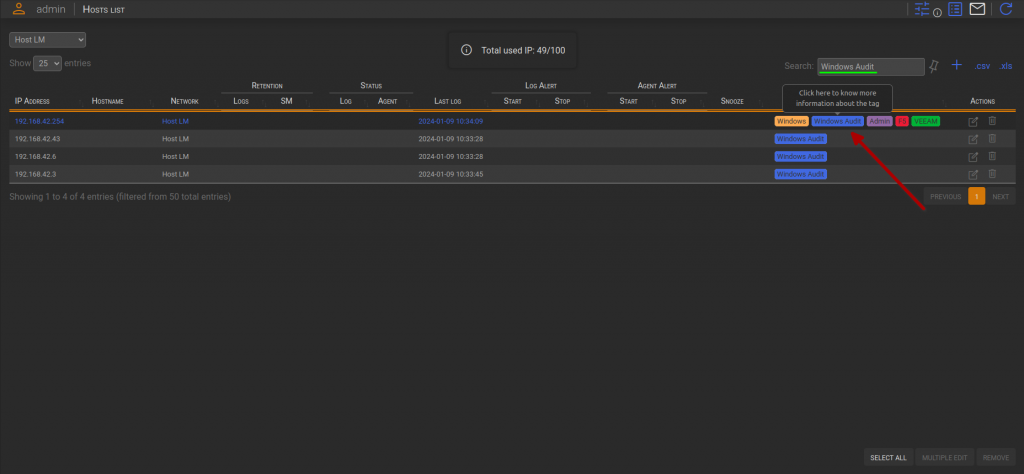
Every host can be associated with one or more tags. By clicking on a tag, you will be directed to the tag page, where you can find more information about the tag. You can also search for the tag in the search box to find all the hosts associated with it.
New Host
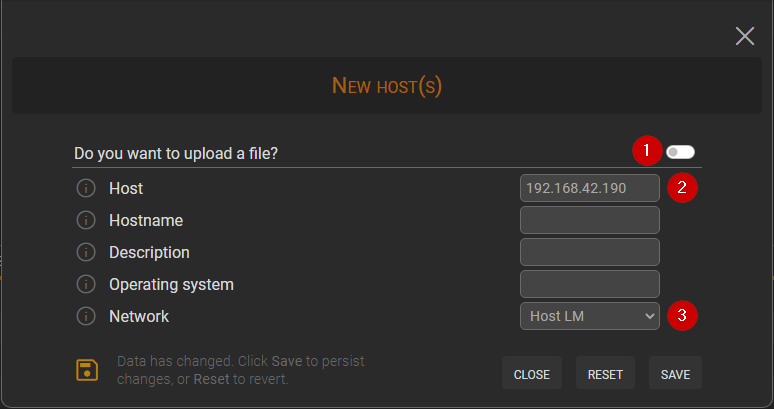
It is possible to alternate to the “Import host” view by toggling the switch. (1)
In this window, you can add a new host by filling the “host” field (2) and selecting the network (3). The “host” field can accept either an IP address or a host name. The hostname, description and operating system are optional.
Please note that special characters are not allowed.
Import Host
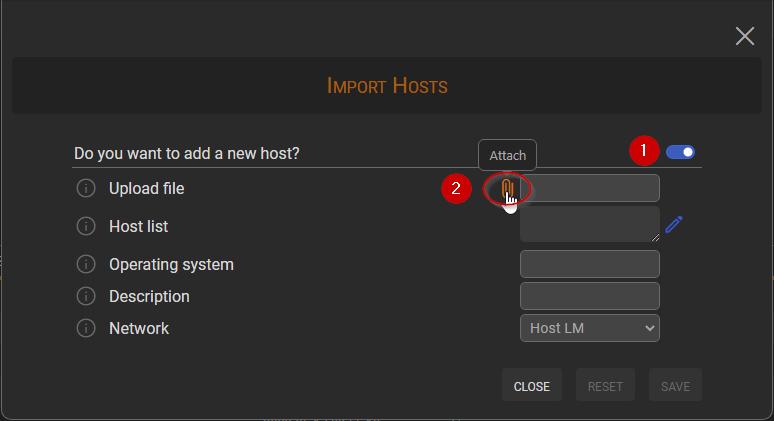
It is possible to alternate to the “New host” view by toggling the switch. (1)
By clicking on the attach icon (2) you can upload a file using the default dialog.
Please note that the fields do not allow special characters.
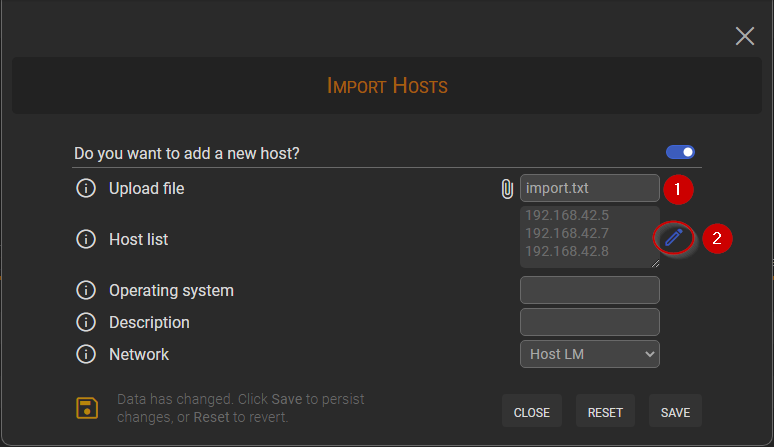
The filename is displayed in the input field (1), and the content is shown in the text area. They can be modified by clicking on the icon in the red circle (2).
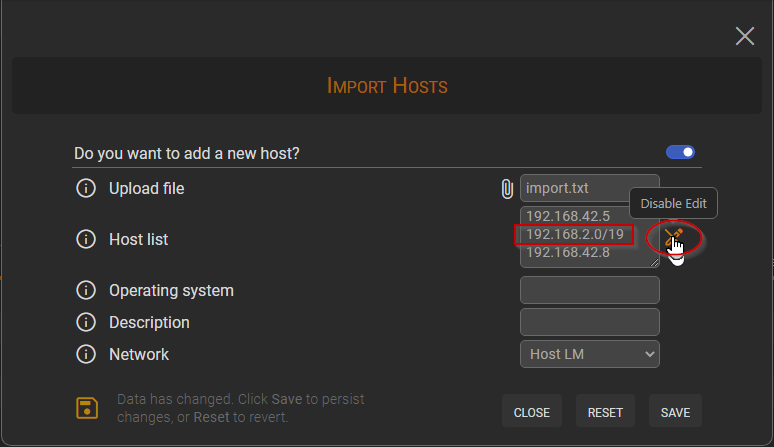
After clicking on the icon (2) it is possible to write in the text area.
You can upload the hosts by the subnet mask.
For example:
Selection
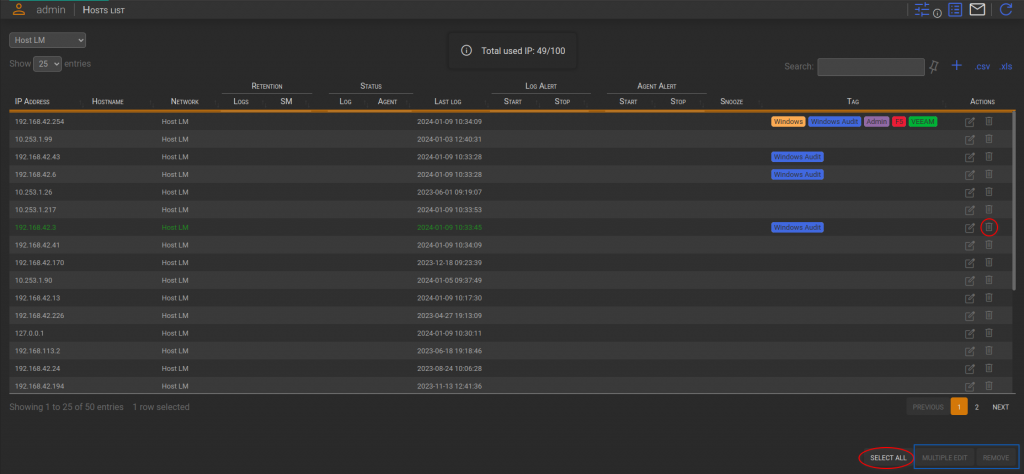
To remove or perform a multiple editing, you must select one or more hosts. You can select them by clicking on the rows or by using the “Select All” button. To execute multiple editing, you need to select at least two hosts. After clicking the “Select All” button it will change to “Deselect All” button.
Edit Host
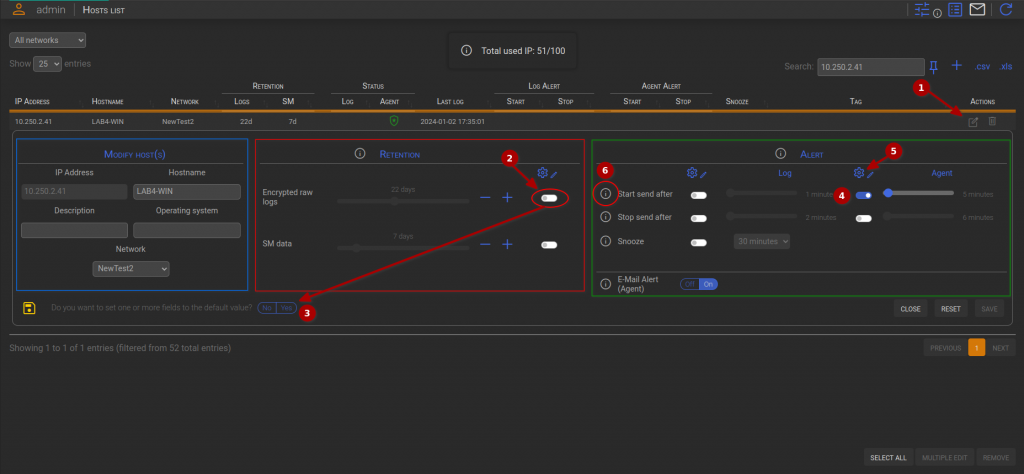
Host Editing is allowed by clicking on the “Edit” icon. (1) This area reports the information in the input fields, which are used to make changes to host information (boxed in blue), retention (boxed in red) and alert (boxed in green).
The circled switch (2) has just been flipped to set the default value expressed in the information box (for example 180 days). To persist the changes, you have to authorize it through the group button (3).
The switch (4) dedicated to value customization is recognizable by the “Authorize customization” icon (5) placed at the top.
Retention section
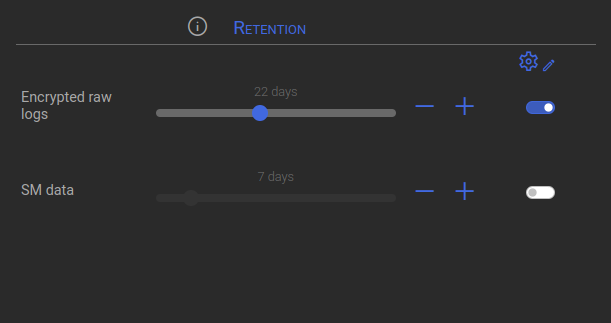
The “Retention” section allows you to modify the raw logs and SM Data conservation. If the input is disabled and its switch is turned off, it means that SGBox will use the default value available in the Advanced option page, otherwise you are able to customize the value for the specific host. You can retain data from one day up to 10 years.

Alert area
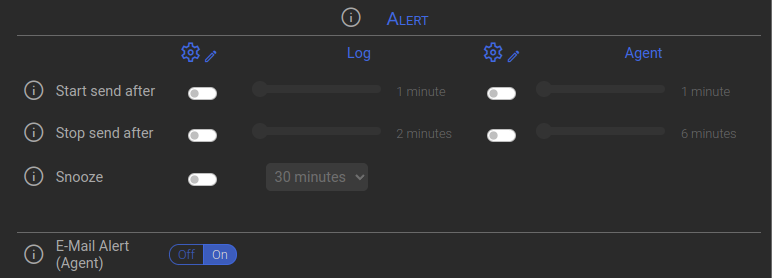
In the “Alert” section you can set different values to receive alerts. The alerts can be referred to log(host) or last connection(agent).
To learn more about using alerts, click here.
Snooze field
When the “Snooze” timer is set it is possible to choose whether the Snooze should start from the “Current time” or the “last log”.

Multiple editing
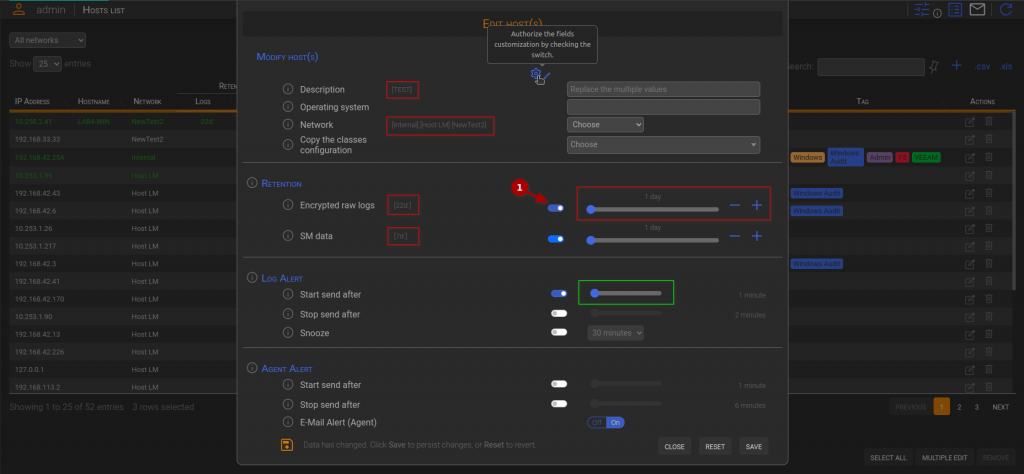
This view allows the editing of the selected hosts and it performs the same functions as the Edit host view.
The common information of the selected hosts are reported in the input fields, as shown in the green rectangle. The red boxes indicate when a field is being updated with a different value. In this case, the switch(1) is turned on to allow value customization. Naturally, the user can return to the default value by deactivating it. The default value is expressed in the information box or in the Advanced Options page.
- Classes configuration → The user selects a host from the combo box to copy the associated classes to all the selected hosts.
Remove
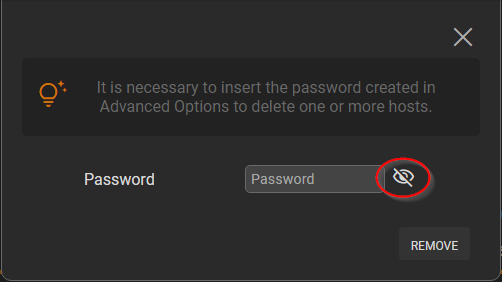
After choosing the host(s) (Select single host or Select all ) you can remove it/them from this view below:
By clicking on the eye icon is possible to hide/show the password
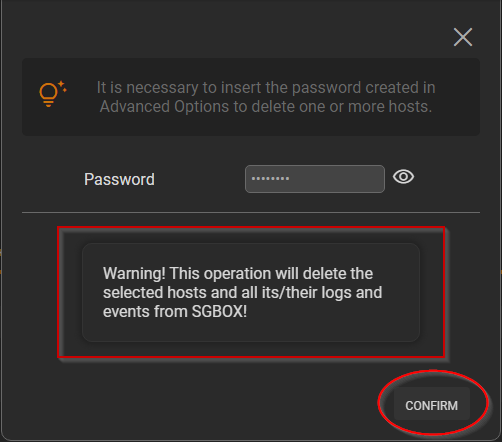
If the user enters the correct password this message will appear and the hosts can be removed.
Alert explanation
Log alert
Start send after
The system shows an alert when the host is not sending logs since X minutes.
This duration can be adjusted and set from 1 minute to 4 hours.

Stop send after
The “Stop Send After” timer is employed to halt the alerts arrival. For instance, if an alarm is set for 2 hours, SGBox will continue to send alerts for that duration. After 2 hours, it will cease sending alerts. However, if the timer is not set, SGBox will consistently send alerts wherever necessary.
This timer can be adjusted from 2 minutes to 4 hours.


Snooze
If the “Snooze” timer is set, the alerts are hidden for a specified duration, represented by X minutes. During this time, the “Start send after” and “Stop send after” timers are not considered until the “Snooze” timer expires.
The snooze time is displayed to indicate when the snooze period will end.

It is possible to set the “Snooze” timer from the last log
For example:

It displays the last log in the message box (1) because the user might miss it when it arrives.


You can disable it in the Edit Host or Multiple Editing.
Agent alert
When no timer is set, The system displays the “Agent” icon within the message box, indicating the time of the agent’s last connection.
The logic follows that of the “Start send after” timer of logs.
Typical view:

Start send after
If the timer is not set, the “Agent status” icon will always be green.
The system triggers an alert when the agent hasn’t sent commands for a specified duration, represented by X minutes.
In the example below, the agent hasn’t communicated with SGBox for more minutes than the “Start send after” time (1 minute), causing the icon to turn red.
This timer can be adjusted from 1 minute to 4 hours.

If communication had occurred within the last 15 minutes, the icon would have remained green.

Stop send after
If the agent fails to send logs to SGBox beyond the limit set by the “Stop send after” timer, the icon will become grey.
This timer is adjustable from 1 minute to 4 hours.
Below are some examples:
- Last command: 12:00
- Start send after: 1 minute
- Stop send after: 15 minutes
- Current time: 12:32
- Alarm becomes red: 12:01
- Alarm becomes grey: 12:16

- Last command: 12:00
- Start send after: 45 minutes
- Stop send after: 3 hours
- Current time: 12:32
- Alarm becomes red: 12:45
- Alarm becomes grey: 15:45

- Last command: 12:00
- Start send after: 1 minute
- Stop send after: 2 hours
- Current time: 12:32
- Alarm becomes red: 12:01
- Alarm becomes grey: 14:01

Settings
The settings are editable by clicking on the “Setting” Icon, indicated by the red box. The host page has one function, in other pages may exist additional settings to configure.
The “Save” icon (1) takes into account the value of the script interval timer and the button group value, highlighted in green.
(2) It executes the function instantly, providing immediate results.
The label circled in blue indicates the script interval time, which updates dynamically as the input changes. You can find more information about single function/script by hovering over the related information icon.

Messages
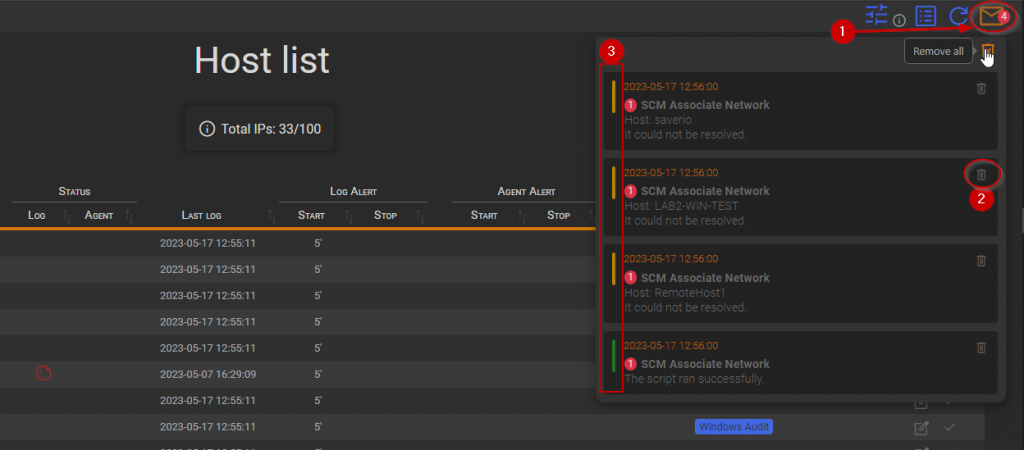
SGBox can produce different types of messages to inform the user about script/functions executed in background. The “Message” icon (1) allows to open this window.
The messages are structered as follows:
- Timestamp → Indicates the time of message arrival.
- Severity → Represents the gravity level of the message.
- Green → Indicates information
- Yellow → Indicates a warning
- Red → Indicates a problem.
- Script/Function name
- Count → Specifies how many times the same message has arrived at different moments. The displayed timestamp will always reflect the last occurrence.
- Info
