Search another article?
SGBox Troubleshoot
There are some tools you can use via CLI in order to check if there are some problems to receive or visualize data.
Connect via ssh (using a program like Putty) to SGBox specifying the user cli.
If you haven’t changed them through the wizard, the default credentials are:
user: cli

pass: CL1changePW
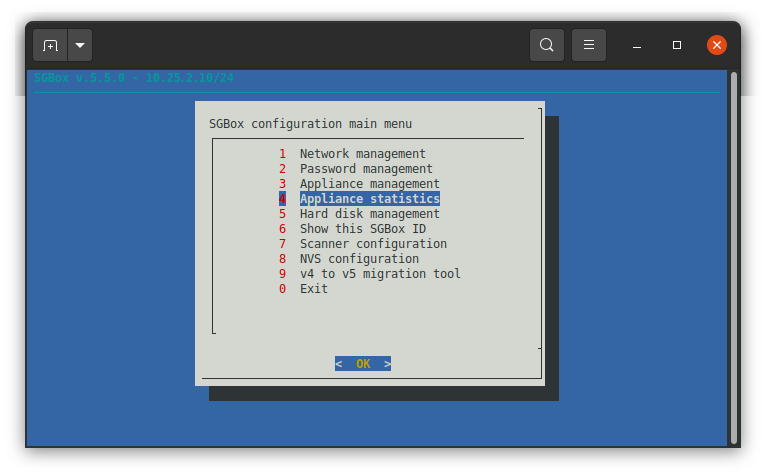
Choose Appliance statistics
Dump network traffic
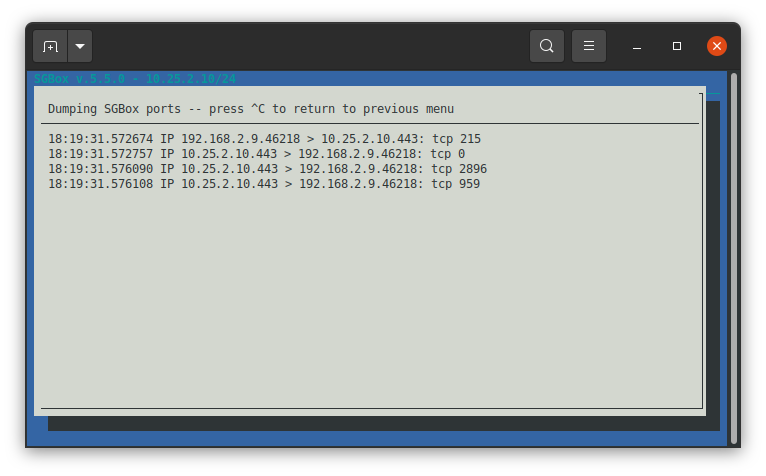
This option allows you to run a tcpdump directly on SGBox in order to check if the platform is correctly receiving logs from the data source, using the right port or protocol.
From
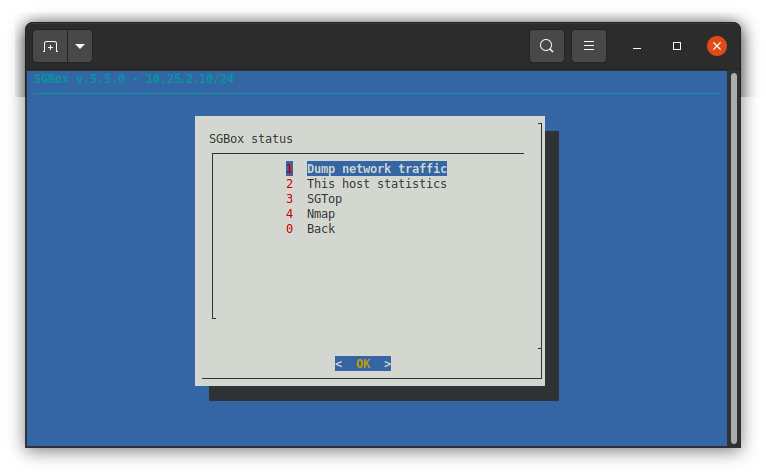
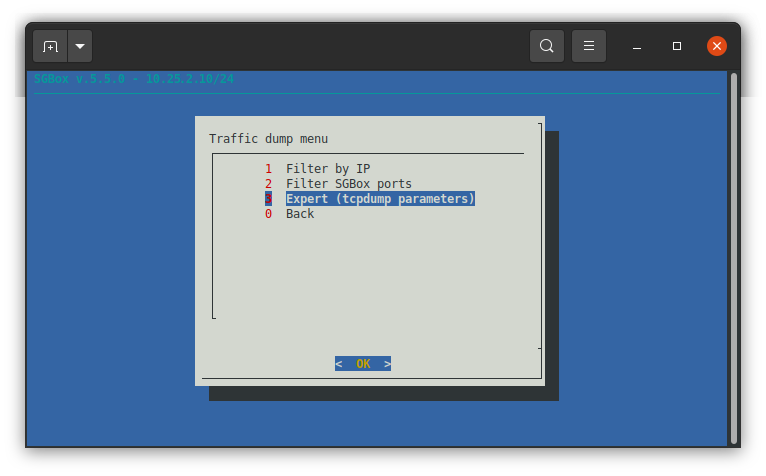
it’s possible choose three different way:
- Filter by IP: simple filter on data source IP all ports and protocols
- Filter SGBox ports: simple filter on ports 514 and 443 from all the data source
- Expert: you can enter all the tcpdump parameters.
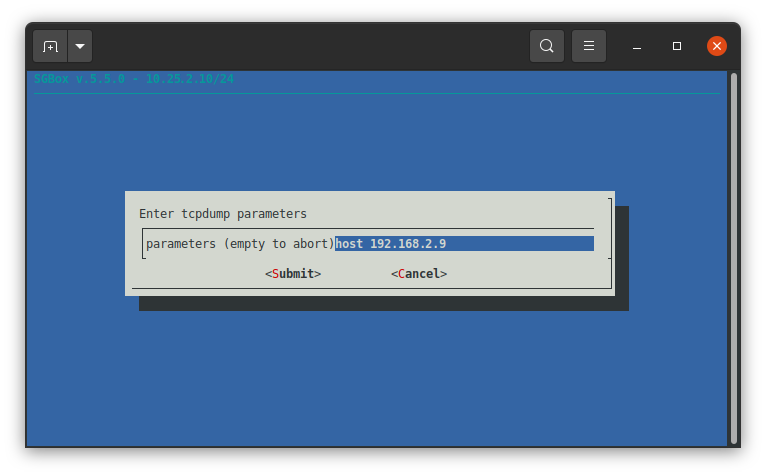
In our example we choose Expert and we filter on host 192.168.2.9.
SGTop
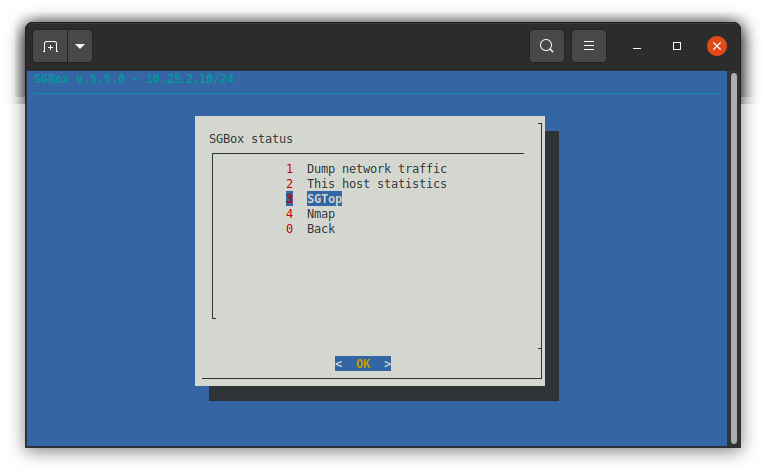
This tool is designed to focus on SGBox processes. If you receive the packets from the data source but you can’t see the logs in SGBox, maybe they are still in the queues. When SGBox has no problems: the queues should contain few objects and you can see your logs in SGBox.
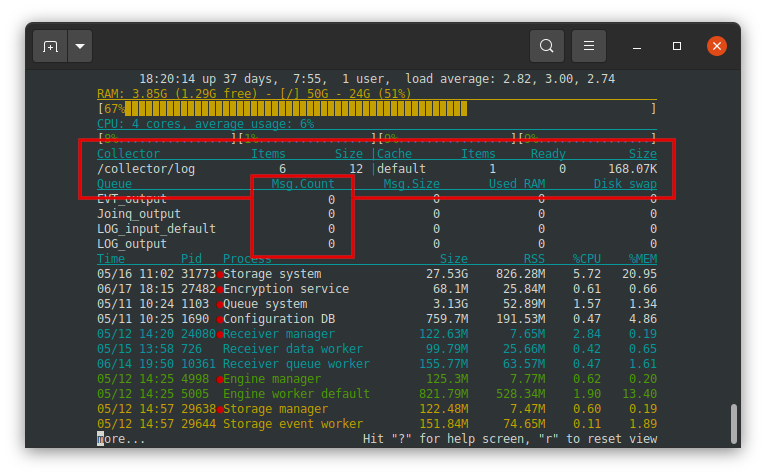
*Queues: is a portion of disk or memory where the logs is temporary stored before to be write to the database.


