Search another article?
The Event Query is a feature introduced from the version 5 that permit to perform SQL style queries from events or logs
Query Purpose
The utilization of queries offers numerous benefits, primarily due to their exceptional speed as a result of the direct access they have to the database where the events are stored.
The primary reasons for utilizing these queries include:
- To replace a LCE Rule
- Generate a statistic (temporary or permanent)
- Generate an event based on a specific event threshold
- Generate an e-mail alert or setup other action triggered by the query
Query Basics
You can follow this KB in order to achieve the basic first-step syntax and compose the very first query: SGBox – Events Queries Basics
Also more details about query directly from logs: SGBox – Events Queries from Raw Logs
Query Options
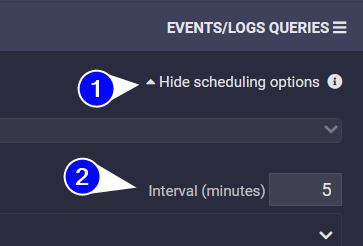
- 🕑 Interval: monitor window where the query looking for (5 minutes in the example). You can find this option in the scheduling options
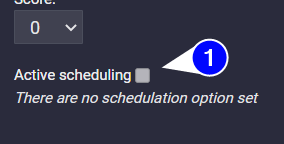
- 📅 Active Scheduling: Query scheduled will run every minute
A timeline summary of the two options combined: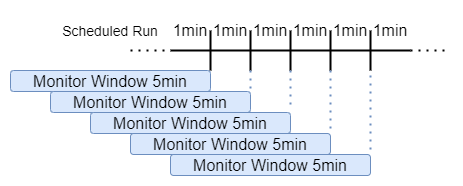
Join
If you need to correlate two different events, and use different WHERE condition in the two query, you can later combine it using the “Join Query” panel.
Here you can define the two query
More details and example you can find it in this KB article:
Advanced Syntax
In a query you can use various functions, as decribed in the list below
Column alias
Every parameter, represented as a column, can be aliased with a name.
The general syntax is:
column AS aliasname
where column can be $TIMESTAMP, $HOST, $EVENT, or any $PARAM:*
The use of the alias is a best practice that permit also to pre-calculate the value in a column, to use it later in the WHERE or FINALLY statement.
Note: some column alias are forbidden to use: ts, Pattern, pid, hid
Functions and Statements
| Function | Position | Example | Definition |
|---|---|---|---|
<column> as columnnamealias | SELECT | $PARAM:[TargetUserName] as User | define a column name (the alias can be referenced later also in WHERE and FINALLY part) |
| count() | SELECT, WHERE, FINALLY | Count the rows by type (must be used in addition with GROUP BY) | |
| min(column), max(column) | SELECT, WHERE, FINALLY | When other columns grouped, select the first or last value of the column set | |
| extract(column, ‘regex (valuetoextract) secondpart’) | SELECT, WHERE, FINALLY | extract($LINE, ‘TargetUserName=”(.*?)” TargetDomainName=’) | Extract part of the value from a column (only first occurrence) |
| extractAll(column, ‘regex(value1)other(value2)’) | SELECT, WHERE, FINALLY | extract multiple value by regex, and output them as Array (not string) | |
| extract(column, ‘(?i)regex (valuetoextract) secondpart’) | SELECT, WHERE, FINALLY | Extract value with case insentive modificator (?i) at beginning of the regex | |
| toString(column or expression) | SELECT, WHERE, FINALLY | convert a column value to a String | |
| uniqExact(column) | SELECT, WHERE, FINALLY | count specific column | |
| arrayStringConcat(extractAll(column, ‘regex (val1) continue (val2)’), ‘separator_char’) | SELECT | Combination of multiextract of values and join to a single string, separated by specific char or string | |
| toStartOfHour(timestamp) | SELECT, WHERE, FINALLY | Round Timestamp to Hour. Similar to toStartOfDay, toStartOfMinute, toStartOfMonth, toStartOfYear | |
| runningDifference(timestamp) as Difference | SELECT | Calculate difference between current and preceeding row (first row always 0) | |
| COLUMNS(‘string or regex’) | WHERE, FINALLY | Select any column match the tring or regex | |
| GROUP BY column1, column2, columnalias1 | FINALLY | Group by similar value in the columns specified. If used all the columns must be referenced in the GROUP BY clause or use in the SELECT an aggregte function (like min(), max(), sum(), avg(), etc.) | |
| HAVING column … | FINALLY | Similar to the filters in the where statement, can be used to filter certain values after the use of the GROUP BY keyword | |
| column IN (‘val1’, ‘val2’) | WHERE | User IN (‘Maya’,’Tom.admin’,’Kevin’) | Filter by one or more value (specific) inside a column |
| column LIKE ‘%Value%’ | WHERE | User LIKE ‘%user%’ | Filter by value contained in column |
| column LIKE ‘%Value’ | WHERE | User LIKE ‘admin%’ | Filter by value at the end of the column |
| column LIKE ‘Value%’ | WHERE | User LIKE ‘%admin’ | Filter by value at the start of the column |
| NOT | WHERE | Reverse a Filter | |
match(mycolumn, arrayStringConcat( (SELECT groupArray(value) FROM $LIST:[regexlist]) , '\|' ) ) | WHERE | Filter mycolumn against custom pre-built regex list | |
| column IN (SELECT value FROM $LIST:listname) | WHERE | Syntax to use to filter values by a list | |
| match(column, ‘myfilterregex’) | SELECT, WHERE, FINALLY | match(User, ‘admin.*|user.*’) | Verify if a regex expression match a column (often used in WHERE) |
| multiMatchAny(column, [‘regex1’, ‘regex2’]) | WHERE | multiMatchAny(User, [‘admin.*’, ‘Kevin’]) | Similar to match, but can verify multiple different regex. Similar but simpler syntax can be obtained with: col1 LIKE ” OR col1 LIKE ” |
| LIMIT number | FINALLY | Limit set of result for number specified | |
| LIMIT number BY column | FINALLY | Limit set of result for each value in column |
Complex ExampleSELECT
count() as cnt,max($TIMESTAMP) as lastlog,sum($PARAM:[packetsize]) as totalsize,extract($PARAM:[longmessage], 'beforetext: (\w+ mystringtocatch) ') as extractedMsg
FROM ()
WHERE
(
extractedMsg LIKE '%anytext%'
OR match($PARAM:[longmessage], 'anyotherstring')
OR extractedMsg IN ('fixedvalue1', 'fixedstring2')
)
AND NOT totalsize > 500
FINALLY
GROUP BY totalsize, extractedMsg
HAVING count() > 10
ORDER BY cnt DESC, lastlog
Troubleshooting
Convert Event Queries as Report
There are two main way to generate (or schedule) a Report starting by an Event Queries
Using dashboard
The steps to follow:
- Generate query (pay attention to order the result correctly with the ORDER BY directive)
- Associate the event query to a new specific dashboard
- Schedule the newly created dashboard as Report
Note: the report will generate only a pdf type attachment. To generate a tabular (csv) report you must use the second solution
By creating a new event
- Generate query and output event as action (define event name and class)
- Schedule the report starting by the newly class created
Event Queries to generate Widget in Dashboard
Some Event Queries can be used as base to fill up widget on dashboard
On dashboard, in the Add Widget Menu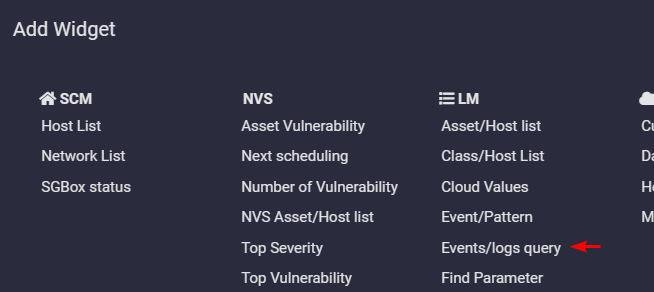
Next in the new window you can manage the source Event Query and the visualization tipology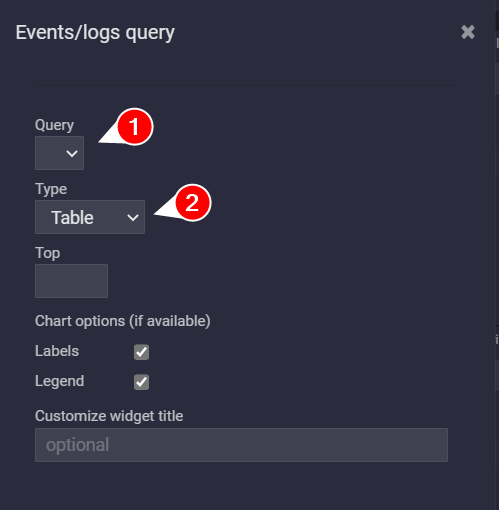
To build up the correct query syntax to match the correct type, please check the next chapter
| Table You can build any type of query to show up as table, only pay attention to the size of the single columns, as in the widget may can be limited or truncated. | 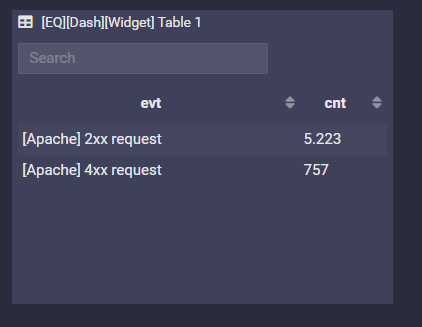 |
| Pie, Any number of columns, but the last column must be numeric (used to build up the slice of the pie). SELECT $EVENT as evt, count() as cnt FROM 4 events on all hosts FINALLY GROUP BY evt | 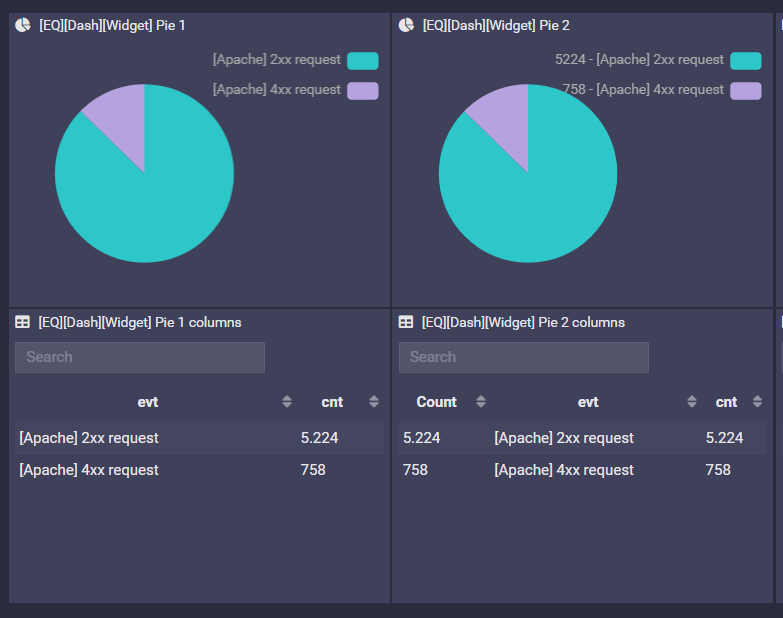 |
| Cloud Any number of columns, but the last column must be numeric (used to build up the slice of the pie). SELECT count() as Count, $EVENT as evt, count() as cnt FROM 4 events on all hosts FINALLY GROUP BY evt | 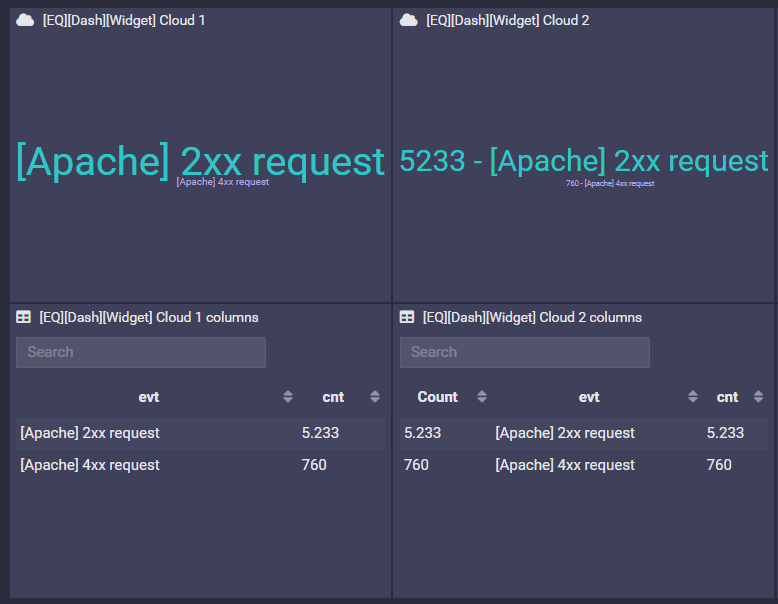 |
| Bar First column is the value in X axis. Other columns must be numeric value, as there are the numeric series. SELECT $EVENT as evt, count() as cnt FROM 4 events on all hosts FINALLY GROUP BY evt | 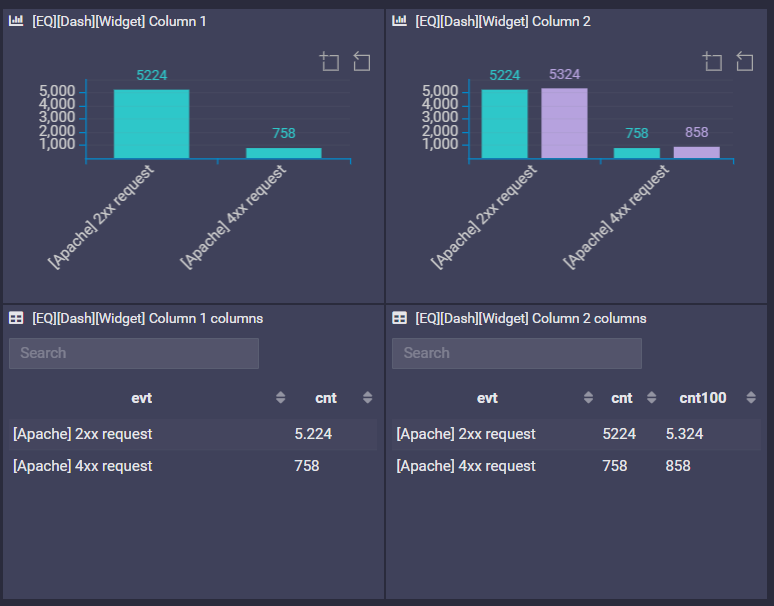 |
Map First column must be an IP address value. Second must be numeric (typically count). SELECT $PARAM:[SourceIP] as SourceIP, count() as cnt FROM 4 events on all hosts FINALLY GROUP BY SourceIP | 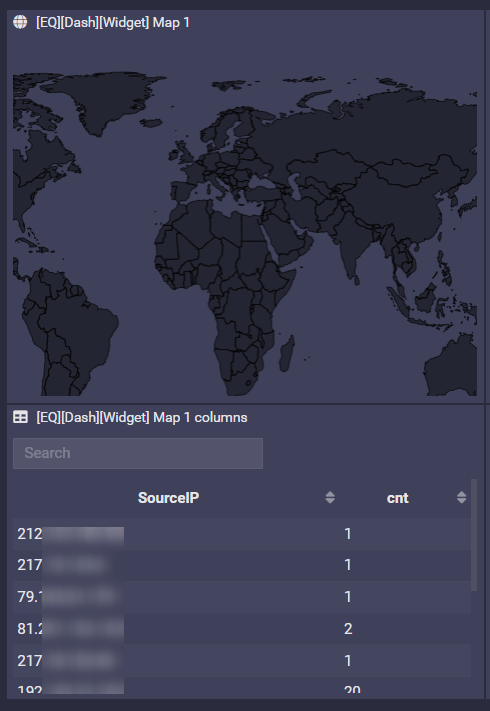 |
Timeline First column must be a Timestamp value (datetime value). Second column must be a string value used for the legend. Last column must be a number (used for the point) SELECT $TIMESTAMP as timestamp, $EVENT as evt, $PARAM:[HttpStatuscode] FROM 4 events on all hosts SELECT $TIMESTAMP as ts, $PARAM:[UserName] as User, count() as cnt FROM 1 event on all hosts FINALLY GROUP by ts,User | 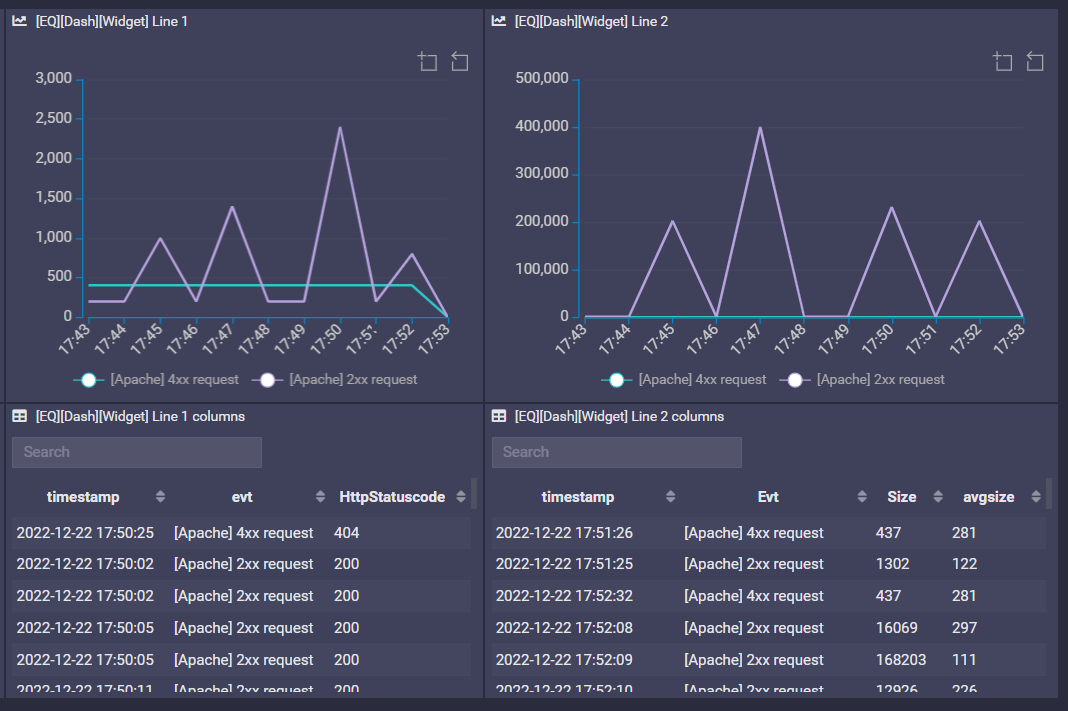 |
Text (Notes) Fixed value in a row and a column SELECT ‘test’ as text FROM all events on 127.0.0.1 . | 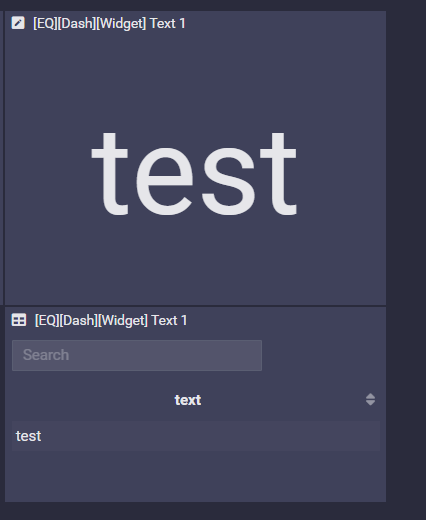 |
Number (Notes) Fixed value in a row and a column SELECT count() as count FROM 4 events on all hosts | 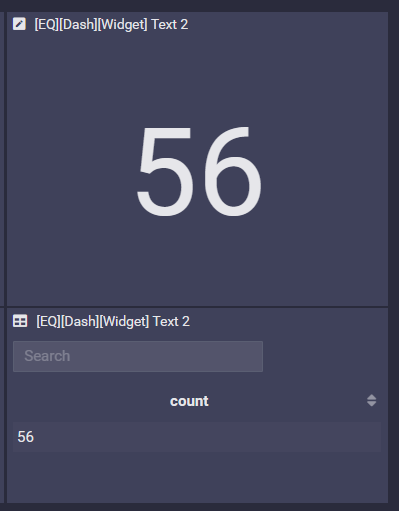 |


